
Measuring video content ROI for SaaS companies is simultaneously the most important and most misunderstood aspect of video marketing. Every SaaS marketing leader knows video works — the engagement data is compelling, the sales team asks for more video assets constantly, and the market data shows that short-form video delivers the highest return of any content format. Yet when the CFO asks "what's the ROI of our video investment?", most marketing teams can't give a precise answer. They point to view counts and engagement rates — metrics that measure attention but not revenue.
This gap between knowing video works and proving video works creates real problems. It makes video budgets vulnerable during planning cycles. It prevents marketing teams from optimizing their video strategy based on business impact. And it means the difference between a $5,000/month video program and a $15,000/month video program often comes down to gut feeling rather than data.
This guide provides a complete framework for measuring video content ROI in SaaS. We'll cover the metrics that actually matter at each funnel stage, how to set up tracking infrastructure, how to calculate true ROI (not vanity metrics), and how to use ROI data to optimize your video strategy. Whether you're building a measurement system from scratch or improving an existing one, this guide gives you the tools to connect video investment to revenue outcomes.
SaaS has unique characteristics that make video content ROI measurement both more complex and more powerful than in other industries:
In e-commerce, a customer might see a video ad and purchase the same day. In SaaS — especially B2B SaaS — the journey from first touch to closed deal can take 30 to 180 days, involving multiple stakeholders and dozens of content touchpoints. A video that introduces a prospect to your brand in January might not result in a closed deal until June. Traditional last-touch attribution dramatically undervalues this type of video content.
The flip side is that SaaS revenue is recurring. A customer acquired partly through video content doesn't generate a one-time purchase — they generate months or years of recurring revenue. When you measure video ROI using customer lifetime value (LTV) rather than first-month revenue, the numbers look dramatically different. A video that helps close a $500/month SaaS deal worth $18,000 over its lifetime has very different ROI than a video that drives a one-time $500 purchase.
Video serves different purposes at different stages of the SaaS buyer journey, and each stage requires different metrics. A top-of-funnel thought leadership video should be measured by reach and engagement. A bottom-of-funnel product demo should be measured by pipeline influence and deal velocity. Applying the same metrics to both leads to misleading conclusions.
Our framework organizes video ROI measurement into four tiers, each building on the previous one. Most SaaS companies should aim to implement at least Tiers 1-3 within their first six months of serious video investment.
Each tier builds on the one below. Start at Tier 1 and progressively add sophistication.
These are the metrics every video platform provides out of the box. They measure attention and interest — necessary but not sufficient for proving ROI.
Key Tier 1 metrics:
How to use Tier 1 data: These metrics tell you which content resonates and which falls flat. Use them to optimize content quality, format selection, and publishing cadence. Don't use them to calculate ROI — they measure attention, not business value.
This tier connects video to lead acquisition — the first bridge between content and revenue.
Key Tier 2 metrics:
How to set up Tier 2 tracking:
This is where video content ROI for SaaS measurement gets serious. Tier 3 connects video engagement to pipeline creation and movement — the metrics that finance teams care about.
Key Tier 3 metrics:
How to set up Tier 3 tracking:
This requires integration between your video hosting platform and your CRM. Specifically:
Real-world example: One SaaS company we work with found that opportunities where contacts watched their product demo video progressed from "Proposal" to "Negotiation" 22% faster than those without video engagement. The resulting 18-day reduction in enterprise sales cycle contributed to $1.5M in additional pipeline velocity per quarter.
The ultimate tier — connecting video directly to revenue. This is the hardest to implement but provides the most compelling ROI calculation.
Key Tier 4 metrics:
Different funnel stages demand different metrics. Here's a comprehensive breakdown:
Awareness video is the hardest to tie to revenue because it's the furthest from the conversion event. But that doesn't mean it can't be measured. The key metrics for TOFU video ROI:
ROI proxy for TOFU: Calculate cost per new brand-aware contact by dividing TOFU video investment by estimated new unique viewers. Compare this to the cost of building brand awareness through other channels (paid display, PR, events).
MOFU video is where measurement gets more direct. These videos are designed to move interested prospects toward evaluation and engagement.
BOFU video is the most directly measurable. These videos are viewed by identified prospects in active sales conversations.
Most SaaS companies completely ignore post-sale video ROI, missing a massive opportunity. Onboarding videos, feature tutorials, and community content directly impact retention — the most important lever in SaaS economics.
Effective measurement requires the right tools connected in the right way. Here's the recommended tech stack for SaaS video ROI measurement:
Don't host marketing videos on YouTube alone — you'll miss critical analytics. Use a business video platform that provides:
Top options: Wistia (best analytics), Vidyard (best for sales video), Vimeo OTT (best for video libraries). Cost: $100-$500/month depending on scale.
Your CRM needs to receive video engagement data. This means:
Most video platforms offer native integrations with HubSpot and Salesforce. Set up these integrations before launching your measurement program — retrofitting is much harder than starting right.
For sophisticated multi-touch attribution that properly credits video, consider tools like:
Connect your video, CRM, and attribution data in a BI tool (Looker, Tableau, Google Data Studio) to create unified dashboards that show video ROI alongside other channel ROI. This enables comparative analysis and makes budget allocation decisions data-driven.
Now let's put it all together with a concrete ROI calculation methodology.
Include all costs associated with your video program:
Example: A SaaS company spending $5,000/month on an editing partner, $500/month on tools, $2,000/month on paid promotion, and $3,000/month in internal team time has a total monthly video investment of $10,500, or $126,000 annually.
Using your Tier 3 and Tier 4 tracking, identify all closed-won revenue from opportunities where at least one contact engaged with video content during the sales process. Apply an influence weight based on your attribution model:
For most SaaS companies starting out, a linear attribution model with a 30% video influence factor is a reasonable starting point. This means if an opportunity worth $50,000 was influenced by video (among other touchpoints), you'd credit video with $15,000 of that revenue.
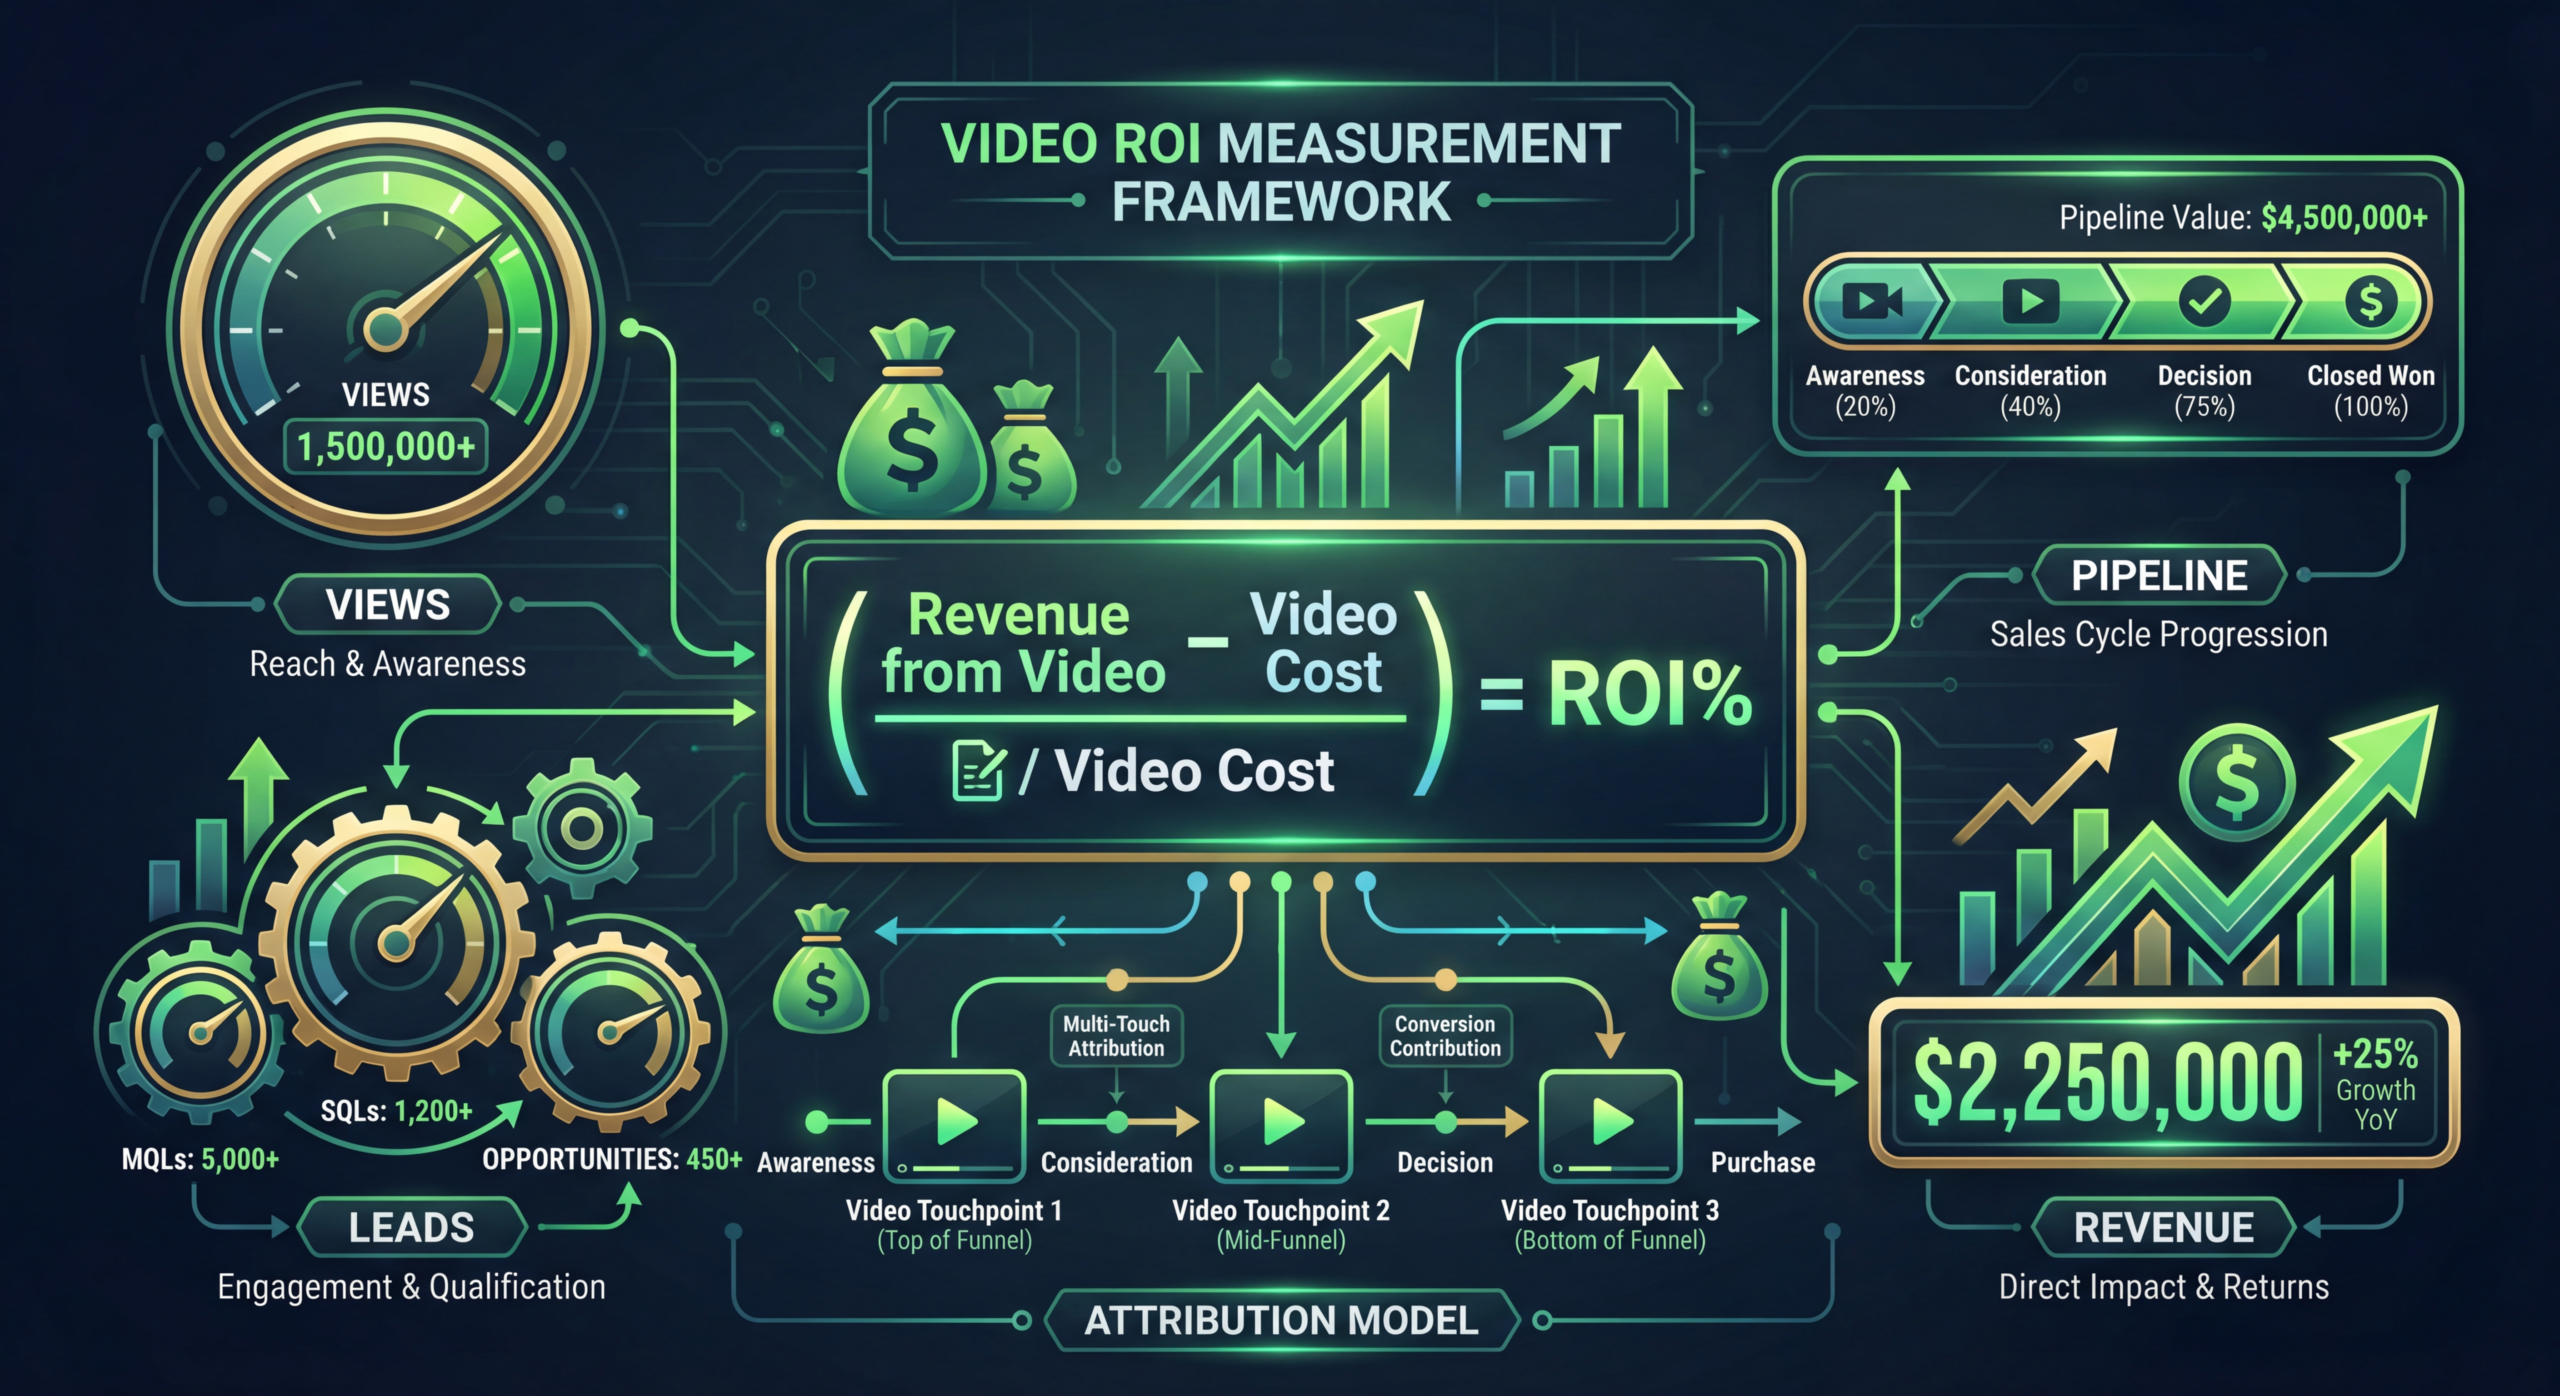
The formula is straightforward:
Video ROI = ((Video-Influenced Revenue - Total Video Investment) / Total Video Investment) × 100
Example: $126,000 annual investment produces $756,000 in video-influenced revenue (using 30% influence factor on $2.52M in total influenced pipeline closed-won).
ROI = (($756,000 - $126,000) / $126,000) × 100 = 500% ROI
This is conservative, as it doesn't account for:
Views are to video ROI what impressions are to advertising ROI — a starting point, not an endpoint. A video with 100,000 views and zero conversions has lower ROI than a video with 500 views that directly influences a $50,000 deal. Always connect view-level metrics to business outcomes.
Most SaaS companies only measure video's impact on customer acquisition. But in SaaS economics, retention is more valuable than acquisition. A video tutorial that reduces churn by 2% can be worth more than a video campaign that generates 50 new leads. Measure video's impact across the entire customer lifecycle.
Don't compare video ROI to paid search ROI and conclude that video is less efficient. Paid search captures existing demand; video creates demand. They serve different purposes and should be measured differently. Compare video to other demand-creation channels: content marketing, events, brand advertising.
Prospects who watch your videos might be more engaged to begin with — meaning video viewing is correlated with purchase intent rather than causing it. To address this, compare outcomes not just for "watched video vs. didn't" but also look at engagement depth: do prospects who watched more minutes of video or more types of video convert at even higher rates? If so, it suggests video is adding value, not just being viewed by already-interested people.
Don't let perfect measurement paralyze you. Start measuring what you can today (Tier 1-2), build toward what you need (Tier 3-4), and make directional decisions based on imperfect but improving data. A rough ROI estimate is infinitely more useful than no estimate at all.
Create a single dashboard that tells the story of video's business impact. Here's what to include:
Once you have measurement in place, use the data to optimize. Here's how:
Identify your highest-ROI video types and increase production. If customer testimonials consistently influence closed deals, produce more of them. If your educational YouTube series generates the most leads per dollar, expand the series. Data should drive your content calendar, not assumptions.
Be willing to stop producing content types that don't generate business results, even if they get views. A fun, trendy video format that gets lots of engagement but doesn't lead to pipeline should be deprioritized in favor of formats that do.
Your ROI data will reveal which distribution channels generate the most business value per dollar. Maybe LinkedIn organic drives the most pipeline while YouTube drives the most total views. Use this data to allocate your distribution and promotion budget accordingly.
Your Tier 3 data will show where video has the strongest correlation with pipeline movement. If BOFU videos (demos, testimonials) have the highest pipeline influence, ensure you have comprehensive BOFU video coverage before expanding your TOFU investment.
Based on our work with SaaS companies and industry data, here are the benchmarks you should target:
ROI calculated using linear attribution with 30% video influence factor. Actual results vary by ACV, sales cycle length, and video quality.
Important context: ROI compounds over time because:
How you present ROI data matters almost as much as the data itself. Here are principles for effective presentation to executives:
Start with the business outcome: "$X in video-influenced revenue this quarter, representing a Y% ROI on our video investment." Views and engagement are supporting detail, not the headline.
A single quarter of ROI data is useful but not conclusive. Show trailing 6-month or 12-month trends to demonstrate that video ROI is improving as your program matures and your measurement becomes more sophisticated.
Context matters. Show video ROI alongside other channel ROI (content marketing, paid advertising, events) so leadership can see relative performance. Video often compares very favorably, especially on a cost-per-influenced-dollar basis.
Numbers alone don't tell the complete story. Include qualitative data: sales team feedback on how video helps conversations, customer comments about video content, competitive analysis showing peers' video investments. These reinforce the quantitative story.
Every ROI presentation should end with a recommendation: maintain investment, increase by X%, or shift allocation toward higher-performing content types. Use the data to justify specific budget requests.
For established video programs (12+ months), target 300-800% ROI using a multi-touch attribution model with a 30% video influence factor. Newer programs should expect 100-200% ROI in the first year as you build your library and optimize your approach. The best-performing SaaS video programs report 8:1 or higher returns on investment based on influenced closed-won revenue.
Expect 3-6 months before measurable pipeline impact becomes visible, and 6-12 months before you can calculate reliable ROI. This lag exists because SaaS sales cycles are long, video libraries need time to build, and audience effects compound over time. Short-form social video typically shows engagement ROI fastest (within weeks), while long-form content shows revenue ROI over months.
The metrics that matter most depend on your funnel stage, but the most important single metric is video-influenced pipeline — the total value of sales opportunities where at least one contact engaged with video content. This metric bridges the gap between marketing activity and revenue outcomes. Complement this with engagement metrics (completion rate, engagement rate) for content optimization and revenue metrics (influenced closed-won revenue) for ROI calculation.
Use a multi-touch attribution model rather than first-touch or last-touch. Start with linear attribution (equal credit across all touchpoints) as your baseline. If video appears in the conversion path of an opportunity, credit it proportionally. A practical approach: if a deal worth $100K had 10 content touchpoints and 3 were video, credit video with 30% (or $30,000) of influenced revenue. Refine your model over time as you collect more data.
Yes. Brand awareness videos should be measured by reach, brand recall, and assisted conversions. Product demo videos should be measured by demo requests and pipeline influence. Customer testimonials should be measured by win rate impact and deal velocity. Sales enablement videos should be measured by sales cycle reduction and close rate improvement. Apply the metrics-by-funnel-stage framework from this guide to match each video type to its appropriate success metrics.
At minimum: a business video hosting platform (Wistia or Vidyard — $100-500/month), CRM integration (native with HubSpot or Salesforce), and UTM tracking on all video CTAs. For advanced measurement, add a marketing attribution platform (Bizible, Dreamdata) and a BI tool (Looker, Google Data Studio) for unified reporting. Total cost of measurement infrastructure: $200-$1,000/month depending on scale.
If you're building a video ROI measurement system from scratch, here's a 90-day implementation plan:
The key is to start measuring before your measurement system is perfect. Every month of data you collect makes your ROI calculations more accurate and your optimization insights more actionable.
Plan your video content strategy with our pre-built calendar template. Includes content type recommendations by funnel stage, publishing cadence guidelines, and integrated KPI tracking.
Get the Calendar Template See Pricing